Tamela Maciel

PhD astrophysicist. Data Scientist.
Space Communications Manager.
Physics editor. Science writer.
View My LinkedIn Profile
Find Me On Twitter
Radio Source Ruler
By Tamela Maciel, 2013
An image analysis tool to automatically measure jets and lobes of radio galaxy images. This code was developed in 2013 as part of my PhD research in ‘Radio Source Evolution’.

Background:
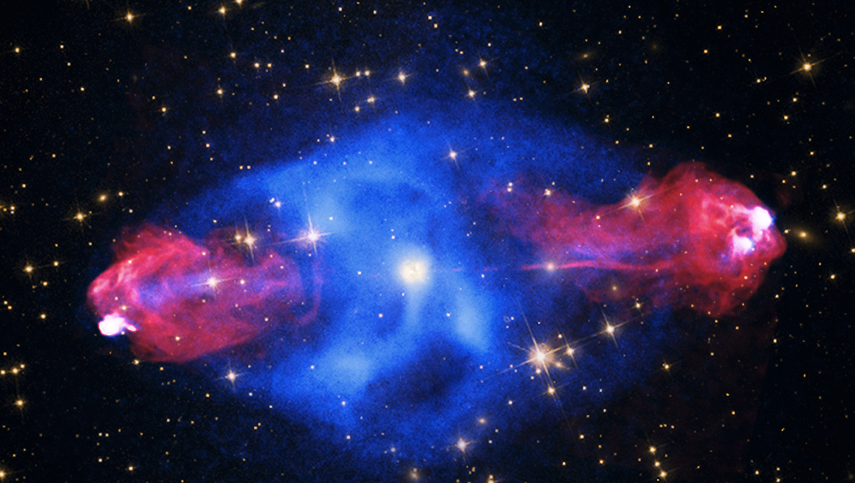
Radio galaxies are some of the largest, most powerful engines in the universe. Supermassive black holes power twin jets of plasma that blast through enormous distances and shape the destiny of the galaxy in which they reside.

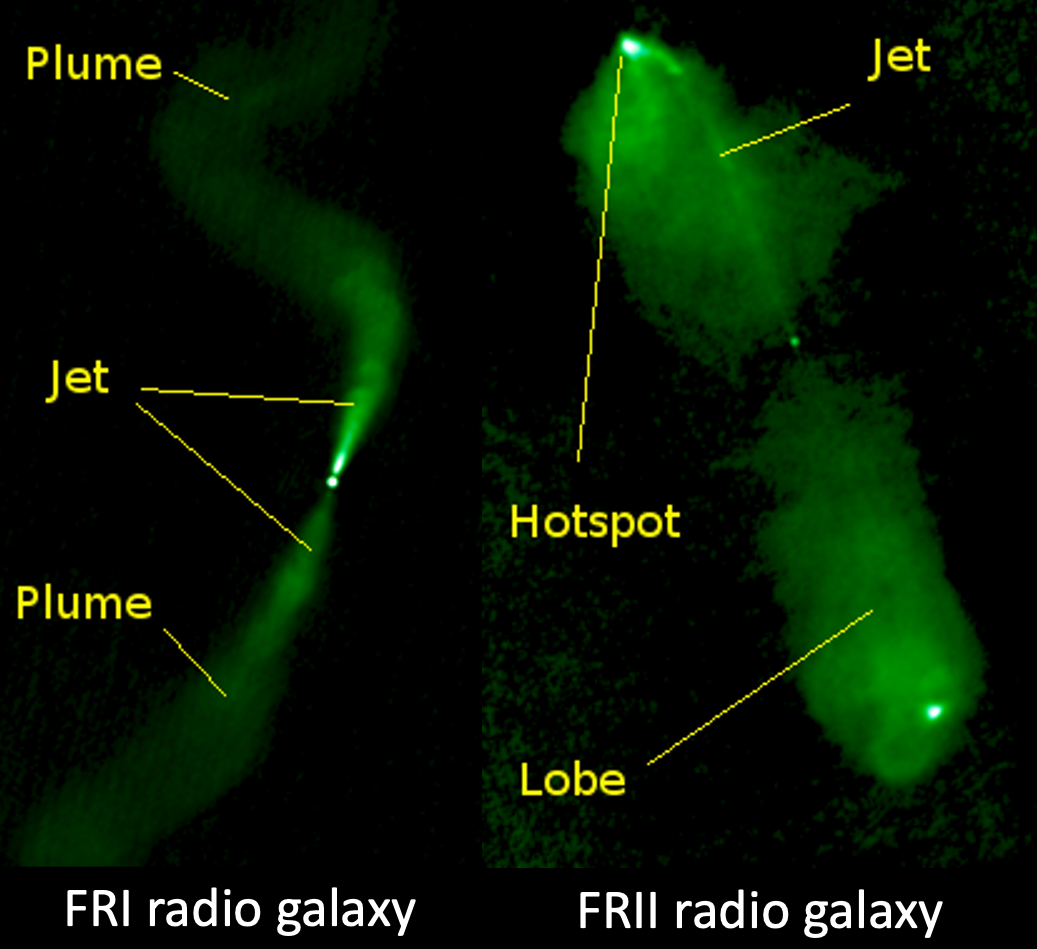
Radio galaxies were first detected in the late 1940s and early 1950s, and are now ubquitous features in the radio sky. In the 1970s, a classification scheme was proposed for the two common shapes of radio galaxies:
- Fanaroff and Riley Class I (FRI) - less powerful plumes that are brightest at the centre of the galaxy and which lack a clear shock front (hotspot) at the end of the jet.
- Fanaroff and Riley Class II (FRII) - more powerful jets that end in a clear shock front, known as a ‘hotspot’.

Today, due to the sheer numbers of known radio galaxies, it’s no longer feasible to use traditional techniques in order to measure and classify radio galaxies by hand.
Instead, image libraries can process and measure the shapes of radio galaxy jets and lobes automatically, saving the researcher a great deal of time.
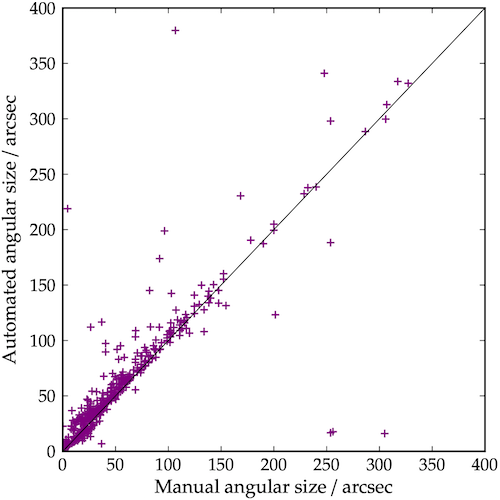
This project arose after I manually measured and classified nearly 1000 radio galaxy images, and the comparison between these manual measures and the automated method presented here is shown below.
Methodology:
Python libraries:
Numpy
Pyfits
Shapely
NDimage from SciPy
Pywcs, gaussfitter, mpfit
Matplotlib
Radio Source Ruler is an automatic routine that completes the following steps to measure and classify a radio galaxy:
- Reads in the FITS file of a radio galaxy
- Calculates a background noise level
- Measures the length of each lobe out to a specified contour above the noise. This length is measured from the optical identification of the galaxy (where available), or else from the radio position.
- If a redshift measure exists for the galaxy, the program converts the lobe angular size to a true physical size using a standard lambda-CDM cosmology model.
- The total source size is calculated as the sum of the two lobe lengths (which allows for bent sources).
This automated approach is a more consistent way of defining radio galaxy size, and works for the vast majority of extended sources. This program can also robustly identify hotspots in FRII sources, or lack thereof, and thus can approximately classify sources as FRI or FRII based on the existence of clear hotspots.
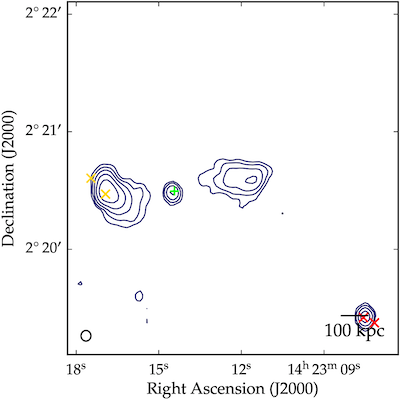
The output of this code is a contour image showing the size measurements for each radio galaxy.

The outer contour level is chosen to be five times greater than the root-mean-square (rms) noise level of the map, unless the ratio of the peak flux to the rms noise level is less than 300, in which case the outer contour level is only three times greater than the noise level. This discretion helps classify particularly diffuse extended sources.
For compact sources with contour sizes less than 3 pixels across and with only one discernible brightness peak, a 2-D Gaussian fit is attempted. This gives an upper limit to the true size of compact radio galaxies.
Key results:
The agreement between my manually-determined sizes and this automated program is shown in the figure below, which plots the manual and automated angular sizes for 423 extended radio galaxies sources (not including compact sources). Overall, the agreement between manual and automated size measurements is very good.

This tool can greatly reduce the time required to classify samples of extended radio galaxies and simplifies the comparison of these samples with analytic models.
With very little input apart from the FITS image files and the optical RA and DEC position (or else a radio position), it can provide an objective and accurate measure of extended source size for large radio catalogues. This program has the potential to be useful for the future analysis of large radio source samples where manual size measurements have not be performed and are not feasible.
It has been shown to give size measures on par with manual measurements for the great majority of radio sources in a sample.
Some caveats:
A small handful of sources have automated sizes that are underestimated. These are generally due to large amounts of real diffuse emission from the source that the automated code ignores as being too close to the noise level.
In contrast, sometimes noise artefacts or unrelated radio sources are measured as a real feature, resulting in large over-estimates on the automated size. For example, the radio galaxy 1423+0220 shown here:

Finally, so-called ‘head-tail’ or ‘bent double’ sources with less than 90 degrees between the two jets are not well handled by the program and are not included in the comparison plot above.
For more details see GitHub repository.