Tamela Maciel

PhD astrophysicist. Data Scientist.
Space Communications Manager.
Physics editor. Science writer.
View My LinkedIn Profile
Find Me On Twitter
Clusters of Toronto Neighbourhoods
What are the characteristics of different neighbourhoods in the city of Toronto? Where are the cafes and fast food venues compared to the hotels and restaurants?
By Tamela Maciel, June 2020
ABOUT:
This jupyter notebook completes the first part of my IBM Data Science Professional Certificate through Coursera.
It uses the Foursquare API, BeautifulSoup for webscraping, and various python libraries to gather location data for the city of Toronto and compares and clusters various neighbourhoods using K-Means.

Methodology
First, the key geographic data was scrapped from a wikipedia table of Toronto boroughs, using BeautifulSoup, and from a csv file of postal codes, latitudes, and longitudes.
The top venues within 500 metres of each area lat/long were gathered using the Foursquare API. In order to build a full profile of each area, I dropped those areas that returned less than 10 venues, as these would be biaised heavily to the small number of venues within.
This left 47 areas to cluster. A K-means algorithm was used to cluster these areas based on the top 10 types of venue per each area. In order to select the best number of clusters, K, I iterated the clustering between 1-10 and selected the value K=3 according to the measure of inertia and the ‘elbow method’.
Python libraries
Pandas, Numpy, BeautifulSoup
KMeans from Sklearn.cluster
Folium, Matplotlib
The result
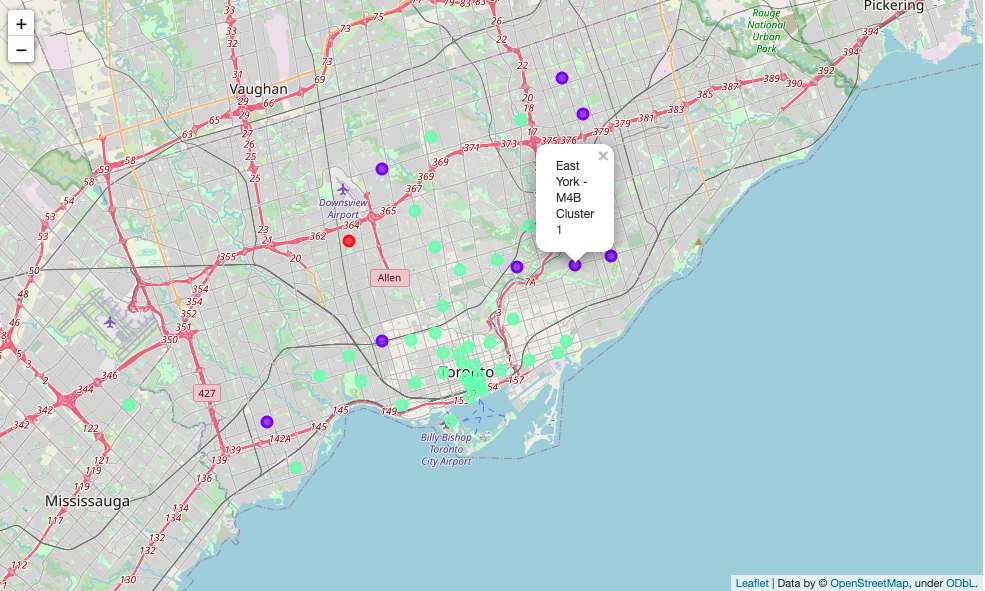
There are three natural clusters of different types of neighbourhoods. This is determined using the ‘elbow method’.
These can be profiled as follows by considering the types of common venues and their geographic location:
-
Cluster 1: Retail shops
-
Cluster 2: Suburb restaurants and grocery stores, 8 neighbhourhoods
-
Cluster 3: Downtown cafes and fast food, 38 neighbourhoods
These three clusters are mapped using folium and coloured according to their cluster label below:

For more details and the jupyter notebook, see the GitHub repository.